

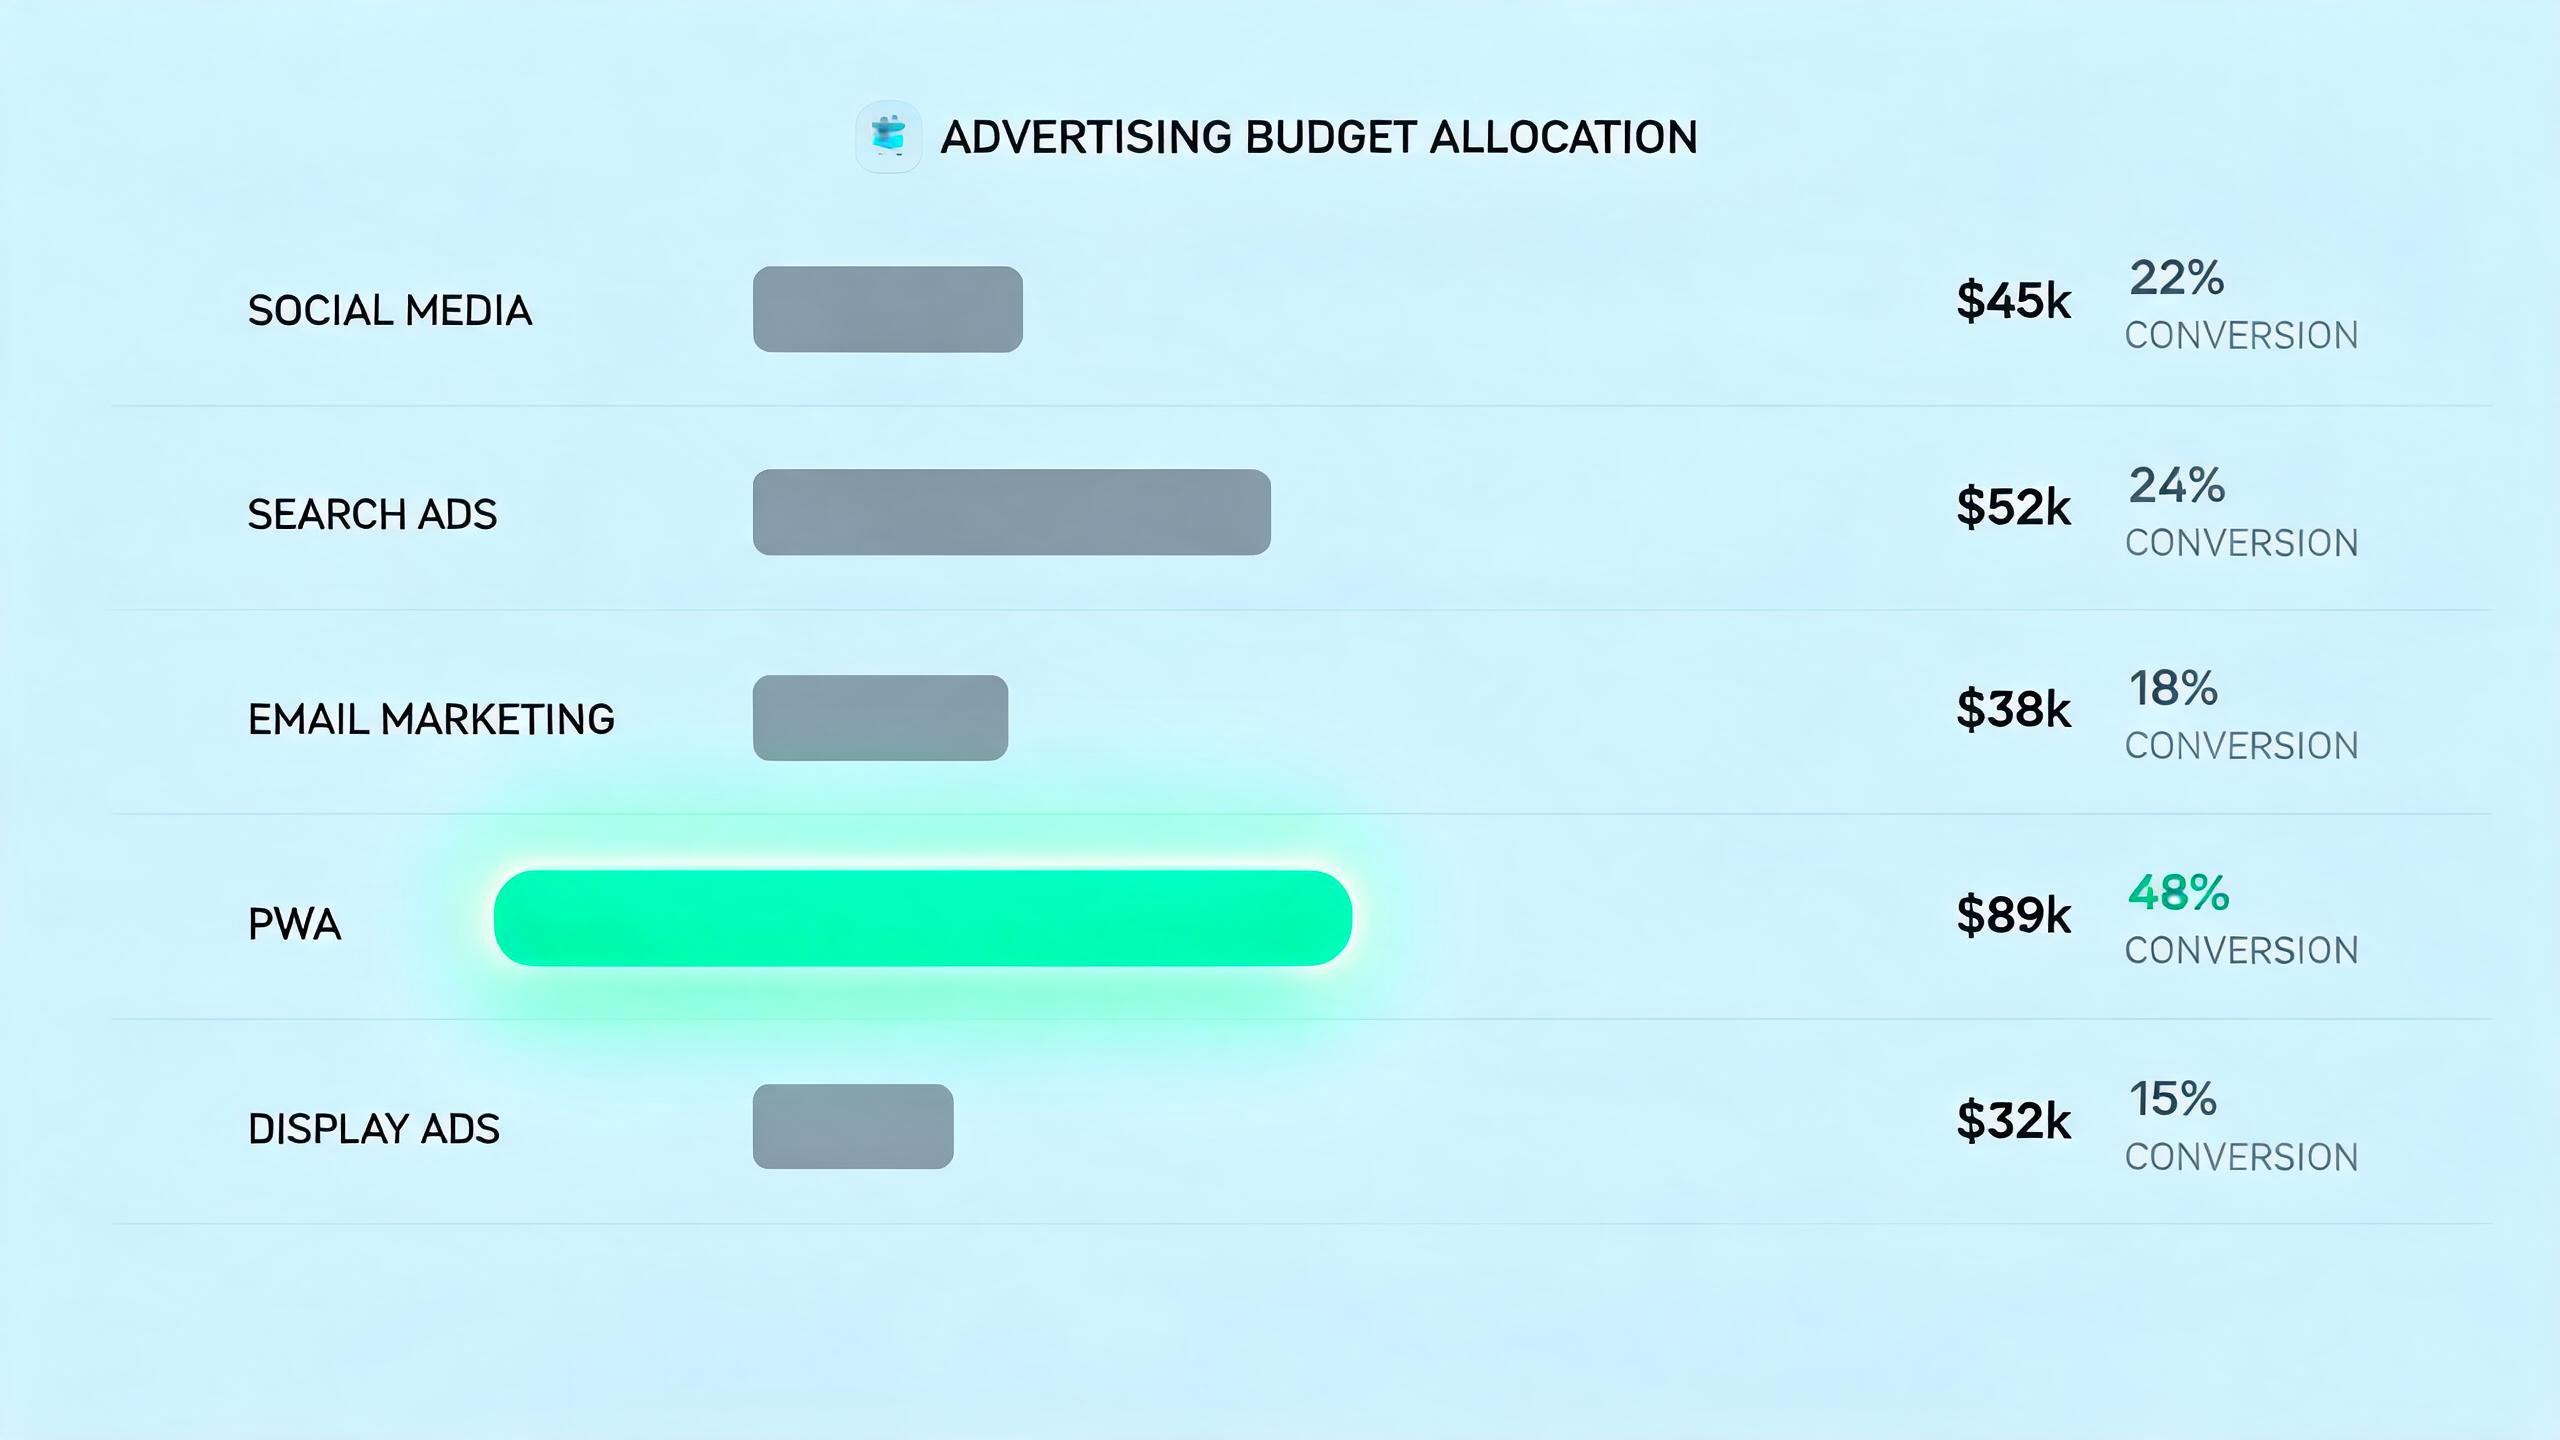
If you are running Google Performance Max campaigns in 2026, there is a question you need to answer honestly: do you actually know where your budget is going? PMax promises AI-driven optimization across every Google surface — Search, Display, YouTube, Discover, Gmail, Maps. But the reality is that most advertisers have almost zero visibility into how their spend is distributed across these channels, and even less control over which channels receive the lion’s share. The result? Budget leaks to low-converting placements while your highest-intent audiences are underserved. The fix is not another bidding strategy tweak. It is rebuilding your conversion endpoint with PWA landing pages — a move that puts you back in the driver’s seat.
→ Want to bypass Google Play entirely? See how ROiBest PWA works — no submission, no cut, 1.2x installs.
The PMax Channel Problem: Where Is Your Budget Going?
Performance Max campaigns were introduced as Google’s answer to fragmented media buying. One campaign, every channel, fully automated. On paper, this sounds like a media buyer’s dream. In practice, it has become one of the most opaque advertising systems in digital marketing.
Here is the core issue: PMax does not give you granular, real-time breakdowns of how your budget is allocated across its seven-plus channels. You get aggregated reporting. You get asset group performance. But you do not get a clear timeline showing that 47% of your Tuesday spend went to Display Network placements on low-quality inventory while only 12% reached high-intent Search traffic.
A 2025 study by Adalytics found that up to 35% of PMax spend on some accounts was allocated to Display and Discover placements with click-through rates below 0.3%. Meanwhile, WordStream’s 2025 Google Ads benchmark report showed that the average PMax conversion rate across industries sat at 2.4% — respectable on the surface, but masking enormous variation between channels within the same campaign.
The channel timeline problem works like this:
- Weeks 1-2 (Learning Phase): Google’s algorithm spreads budget broadly, testing every available surface. Your spend is essentially exploratory, and conversion efficiency is at its lowest.
- Weeks 3-4 (Optimization Phase): The algorithm begins concentrating budget on channels where it detects engagement signals. But “engagement” does not always mean “conversion.” A YouTube view or a Discover click counts as engagement even if the user never converts.
- Weeks 5+ (Steady State): Budget distribution stabilizes, but the algorithm’s preferences are now baked in. If it decided early on that Display was performing (based on click volume, not conversion quality), Display continues to receive disproportionate spend.
The fundamental problem is one of misaligned incentives. PMax optimizes for the signals Google can measure across its own ecosystem. It cannot optimize for what happens after a user lands on your page — especially if your landing experience is a standard app store listing that you do not control.
According to data from Tinuiti’s 2025 Digital Ads Benchmark, advertisers who audited their PMax channel distribution found an average of 22% of budget allocated to channels that produced less than 5% of total conversions. That is not optimization. That is waste hiding behind automation.
Why Low-Converting Channels Kill Your ROAS

Let us get specific about the damage. When PMax funnels budget to low-converting channels, the impact cascades through your entire acquisition funnel in ways that are not immediately obvious from top-line metrics.
The Hidden Cost of Display and Discover Placements
Display Network placements within PMax are particularly problematic for app install campaigns. Google’s own data acknowledges that Display ads have an average conversion rate of 0.77% across industries, compared to 3.75% for Search. When PMax decides to allocate 30-40% of your budget to Display because click costs are lower, it is optimizing for volume, not value.
For app teams, this creates a specific problem. A user who clicks a Display ad often lands on your Google Play listing — a page you did not design, cannot customize beyond basic assets, and where Google takes a 15-30% commission on any resulting revenue. The conversion path from Display click to app install to first purchase involves at least four friction points:
- Ad click to Play Store page (bounce rate: 40-60% industry average)
- Play Store page to install initiation (conversion rate: 25-35%)
- Install initiation to completed install (drop-off: 10-15% due to storage, permissions)
- Completed install to first meaningful action (activation rate: 20-30%)
Multiply these together and your effective conversion rate from Display ad click to activated user is often below 2%. Yet PMax may be sending a third or more of your budget through this funnel.
The YouTube Budget Trap
YouTube placements within PMax present a different but equally costly problem. Video ads generate impressive view-through metrics that look good in reports but often fail to drive direct conversions. A 2025 analysis by Measured found that YouTube placements within PMax campaigns had an average cost-per-acquisition 2.3x higher than Search placements within the same campaigns.
The issue is not that YouTube is a bad channel. It is that PMax treats it as interchangeable with Search, and the algorithm’s “optimization” may favor it because YouTube inventory is abundant and engagement signals (views, watch time) are easy to generate. For teams that need efficient install-to-revenue conversion, this is budget that could be working much harder elsewhere.
The Compounding Effect on ROAS
When you combine opaque channel allocation with a conversion endpoint you do not control (the Google Play Store), ROAS suffers in three compounding ways:
- Budget waste: 20-35% of spend goes to channels with sub-1% conversion rates
- Revenue leakage: Google Play takes 15-30% of in-app revenue from users who do convert
- Data blindness: You cannot attribute conversions to specific channels accurately enough to make manual adjustments
According to AppsFlyer’s 2025 State of App Install Marketing report, the average cost per install for Android apps reached $3.52 in 2025, up 18% year-over-year. Teams that continued relying on PMax defaults without addressing the conversion endpoint saw CPI increases of up to 28%. Meanwhile, teams that optimized their landing experience reported CPI reductions of 15-25%.
If you are running value-based bidding strategies for your Google Ads campaigns, opaque PMax channel distribution undermines your bid signals. The algorithm cannot value-optimize what it cannot accurately attribute.
PWA Landing Pages: Take Back Control
Here is where the conversation shifts from problem to solution. PWA (Progressive Web App) landing pages fundamentally change the conversion equation for PMax campaigns — not through technical tricks, but through a business model shift that puts the advertiser back in control of the entire post-click experience.
Instead of sending PMax traffic to a Google Play listing you cannot customize, you send it to a PWA landing page you own completely. The user installs your app directly from the web — no app store required, no review process, no 30% revenue cut. And critically, you get full conversion data at every step of the funnel.
Teams working with ROiBest to deploy PWA landing pages for their PMax campaigns have reported measurable improvements across every key metric. Here is how to make the shift in practice.
Step 1: Audit Your Current PMax Channel Distribution
Before changing anything, you need to understand your baseline. Pull your PMax campaign data for the last 90 days and examine the Insights tab for channel-level performance indicators. While Google does not give you a clean channel breakdown, you can piece together approximate distribution using:
- Placement reports: Check which URLs and apps your Display ads appeared on
- Asset group performance: Compare performance across asset groups to identify which creative types (and therefore which channels) are driving results
- Conversion action segmentation: Break down conversions by type to see which conversion actions are firing from which campaign elements
- Search terms report: The portion of your budget going to Search is partially visible here — if Search terms volume is low relative to total spend, your budget is going elsewhere
Document the gaps. Most teams discover that 25-40% of their PMax budget is going to channels they would never deliberately invest in at that level. This becomes your business case for the PWA landing page transition.
Step 2: Deploy a PWA Landing Page as Your Conversion Endpoint
Replace the Google Play Store listing as your PMax campaign destination with a purpose-built PWA landing page. This is where services like ROiBest are critical — they handle the entire PWA packaging, hosting, and deployment process so your team can focus on campaign strategy rather than technical implementation.
What changes when you use a PWA landing page:
- Conversion rate improvement: Teams using ROiBest PWA landing pages report up to 1.2x higher install conversion rates compared to Google Play listings. The reason is simple: you control the page design, the messaging, the install flow, and every element of the user experience.
- Full-funnel visibility: Every click, scroll, hesitation, and conversion is tracked on your own analytics. You finally know exactly which PMax channels are driving real installs versus empty clicks.
- Zero revenue share: No 15-30% Google Play commission. Every dollar of in-app revenue stays with you.
- Push notification retention: PWA push notifications work even after a user removes the app icon from their home screen — a capability that native apps lose entirely after uninstall.
The deployment process through ROiBest is designed to be fast. Teams typically go live within days, not weeks. There is no app store submission, no review queue, and no risk of rejection.
Step 3: Restructure PMax Campaigns Around PWA Conversion Data
Once your PWA landing page is live and collecting data, use the new conversion signals to reshape your PMax campaigns. This is where the real ROAS improvement begins.
- Create PWA-specific conversion actions: Set up conversion tracking for PWA installs, first opens, and key in-app events. Feed these back into Google Ads as primary conversion actions for your PMax campaigns.
- Use value-based bidding with real data: With full-funnel conversion data from your PWA landing page, you can assign accurate conversion values. PMax’s algorithm now optimizes toward your actual revenue, not proxy signals from the Play Store. This pairs directly with value-based bidding strategies that drive ROAS.
- Identify and exclude underperforming placements: With proper UTM tracking on your PWA landing page, you can identify which PMax placements drive installs versus bounces. Use placement exclusions to cut the worst performers and redirect that budget toward channels that convert.
Step 4: Scale What Works and Cut What Does Not
After 30-60 days of running PMax with a PWA landing page endpoint, you will have enough data to make definitive channel allocation decisions:
- If Search is driving 60% of your PWA installs at the lowest CPI, consider supplementing PMax with dedicated Search campaigns targeting those high-converting keywords
- If Display is generating clicks but minimal PWA installs, add Display-heavy placements to your exclusion list
- If YouTube is performing for awareness but not conversion, set up separate YouTube campaigns with awareness-specific KPIs rather than letting PMax blur the line
The key insight is that PWA landing pages give you the data clarity that PMax’s opaque reporting withholds. You are no longer guessing. You are measuring, deciding, and optimizing based on your own first-party data.
This approach aligns with the broader shift toward advertiser-controlled attribution that is reshaping paid acquisition in 2026. Teams that control their conversion endpoint control their data, and teams that control their data make better decisions.
Step 5: Implement Ongoing Monitoring and Iteration
PWA landing page optimization is not a one-time setup. Build a monthly review cadence that includes:
- Channel-level CPI comparison: Track cost per PWA install segmented by the traffic source indicators available in your analytics
- Landing page conversion rate trends: Monitor install conversion rate weekly. A declining trend may indicate creative fatigue in PMax assets or seasonal shifts in audience behavior
- Revenue per install by channel: This is the metric that matters most. Some channels may have higher CPI but also higher revenue per user — only full-funnel PWA data reveals this
- Push notification re-engagement rates: Track how PWA push notifications perform for re-engaging users acquired from different PMax channels. This long-term data point often changes the channel value calculus significantly
For a comprehensive guide on setting up your first PWA-based Google Ads campaigns, see our complete Google Ads PWA install campaign guide.
Summary and Action Checklist
Google PMax campaigns in 2026 offer broad reach but minimal transparency. The channel timeline — from learning phase through steady state — bakes in budget allocation decisions that often favor low-converting channels over high-intent ones. When your conversion endpoint is a Google Play listing, you have no visibility into what is working and no ability to fix what is not.
PWA landing pages solve both problems. You control the user experience, you own the conversion data, and you eliminate the revenue share that erodes your margins.
Your action checklist:
- Audit your PMax campaign data for the last 90 days to identify channel distribution imbalances
- Calculate the true cost of Google Play as your conversion endpoint (commission + conversion rate loss + data gaps)
- Deploy a PWA landing page through ROiBest as your new PMax campaign destination
- Set up PWA-specific conversion actions and feed them back into Google Ads
- Implement value-based bidding using your new full-funnel conversion data
- Review channel-level performance monthly and exclude underperforming placements
- Track revenue per install by channel to optimize for value, not just volume
The teams seeing the best PMax results in 2026 are not the ones with the biggest budgets. They are the ones who took back control of their conversion funnel. PWA landing pages are how you do that — and with ROiBest handling the technical side, the transition is faster than most teams expect.
Skip the app store. Go live instantly, keep 100% of your revenue.
ROiBest helps Android app teams launch PWAs — no review process, no 30% Google Play cut, and push notifications that work even after uninstall. Teams see up to 1.2x higher install conversion rates vs native app downloads.
发表回复